
What Is Movement Analysis?
A “moving average” or “rolling average” is a technique commonly used in statistics and data analysis to continuously calculate the average value of a data set over a specific time period. It is mainly used to smooth out short-term fluctuations or to clarify long-term trends and patterns.
Here’s how to calculate the moving average:
- Select a specific “window” or time period (for example, 5 days, 10 days, or 12 months).
- Calculates the average of all data for the selected time period.
- Move forward to a time period (for example, the next day or month) and calculate the average of the data for that period.
- Repeat this process for the entire dataset.
Moving averages are widely used in various fields such as stock price analysis, economic data analysis, and weather data analysis. This removes transient noise, such as daily and seasonal fluctuations, and reveals basic trends and patterns in your data.
Sample table for mobile analysis training
If you want to calculate the moving average using Excel, you will need a data table like this: Let’s take the weekly sales volume of a product as an example. Also, let’s assume that we want to calculate a 3-week moving average.
| week | Number of units sold | 3-week moving average |
|---|---|---|
| 1 | 100 | |
| 2 | 120 | |
| 3 | 130 | |
| 4 | 160 | |
| 5 | 150 | |
| 6 | 150 | |
| 7 | 180 | |
| 8 | 170 | |
| 9 | 210 | |
| 10 | 180 | |
| 11 | 200 | |
| 12 | 180 |
- Starting in the third week, calculate the average of the last three weeks in the “Sales” column and enter it in the “3-week moving average” column. In Excel, we use the AVERAGE function to calculate. For example, the moving average (C3 cell) for the third week can
=AVERAGE(B2:B4)be calculated by entering . - Continue doing this from week 4 to week 12. However, the weekly calculation uses the data of the last three weeks. In other words, the moving average of the fourth week is , the moving average
=AVERAGE(B3:B5)=AVERAGE(B4:B6)of the fifth week is calculated and so on. - The final table should look like this:
| week | Number of units sold | 3-week moving average |
|---|---|---|
| 1 | 100 | |
| 2 | 120 | |
| 3 | 130 | 116.7 |
| 4 | 160 | 136.7 |
| 5 | 150 | 146.7 |
| 6 | 150 | 153.3 |
| 7 | 180 | 160.0 |
| 8 | 170 | 166.7 |
| 9 | 210 | 186.7 |
| 10 | 180 | 186.7 |
| 11 | 200 | 196.7 |
| 12 | 180 | 186.7 |
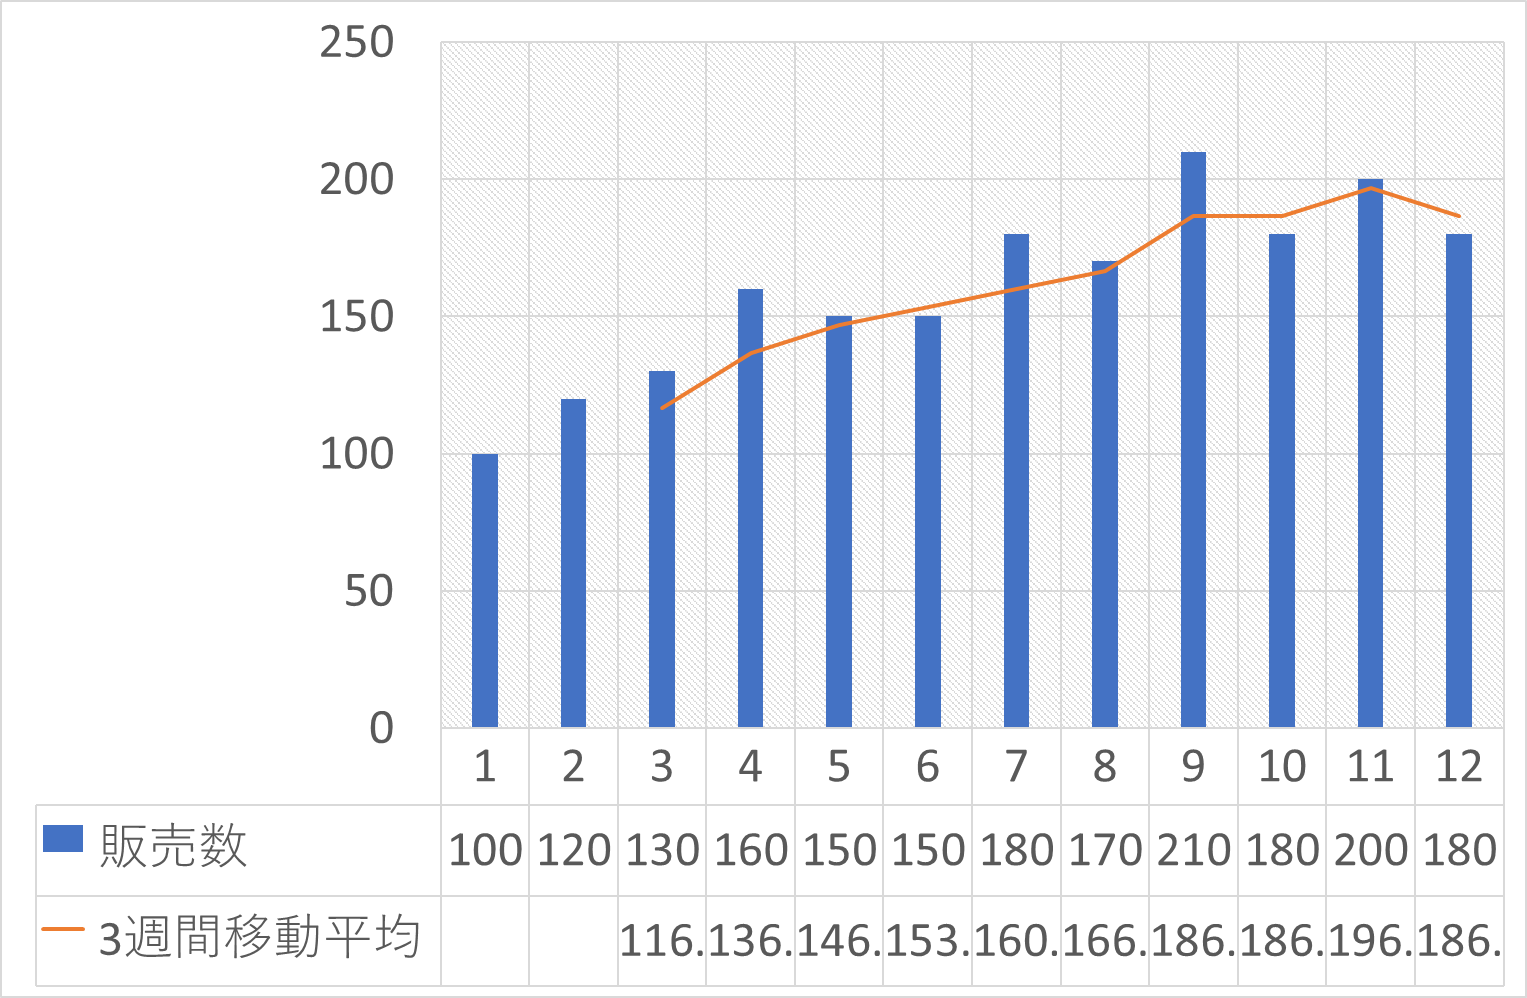
Moving Average Graph Sample
The figure below shows “Week” as the horizontal axis, “Number of Sales” as a column graph, and “Moving Average” as a line graph.
Moving averages have smoother numerical changes than column graphs.
この投稿文は次の言語で読めます: 日本語 (Japanese)